Oct 29, 2021. 10 min

AI-powered Observability for Serverless

We are excited to announce the release of AI-powered Observability solution from CloudAEye. This release supports modern cloud applications running on Kubernetes (ex. microservices), Fargate or Lambda (ex. serverless applications) and EC2/Docker (ex. containerized applications).

Get Freedom from Downtime!

In today’s fast paced environment where downtime and application issues translate directly into loss of revenue and impact to brand perception, we introduce our AI-powered models with a keen eye for detecting errors and interpreting anomalies. Our services can thus save you both time and money and it smoothes the overall process of recovering from failures.

Microservices architecture and orchestration technologies such as Kubernetes are commonly used for building highly scalable applications. This new style greatly increases the complexity of application architectures. The microservices architecture has made monitoring applications and investigating and solving incidents much more complex, especially for large scale production environments. Having a team of humans troubleshoot system failures or detect and analyze anomalies can be slow, inefficient and expensive.

Using an AI solution for monitoring system and application logs and metrics to detect anomalies, error sequences and outliers bridges the gap between the requirement of an efficient monitoring system and the expense, expertise and time it takes to achieve it.

Monitoring Serverless Applications Running on Fargate

AWS Fargate is a serverless compute engine that lets one focus on building applications without managing servers. It allows for building and deploying applications, APIs, and microservices architectures with the speed and immutability of containers. Refer to aws.amazon.com/fargate for more details.

Monitoring such serverless applications is challenging. They are fast paced and are one part of larger deployments. Due to the lack of control over serverless environment - from the observability perspective - the user’s inability to access or modify the infrastructure / environment represents a significant challenge for monitoring.

In this blog, I will describe the services I have worked on to address the use cases with Fargate.

Intelligent Observability Solution with Centralized Logs, Metrics

This provides real-time analysis on system and application logs and metrics to detect anomalies, outliers and errors. The logs and metrics analyzers intelligently analyze the data in real time and can detect errors or any anomalous activities within minutes of their occurrence. This helps to reduce MTTD (mean time to detect).

An anomalous occurrence in your application can include database failures, network errors, killed pods, server overloads, unexpected system activities, a sudden spike in the memory usage, etc.

Instead of you having to pour over millions lines of logs and hundreds of KPIs (key performance indicators) metrics when there is a failure or any of the mentioned technical issues to get to your root cause, CloudAEye will take the responsibility to actively look out for such occurrences. It will notify you as soon as an incident is detected with a link to the dashboard where you can visualize the anomalies in greater detail.

Real-time Monitoring, Visualization and Reporting : A Demonstration

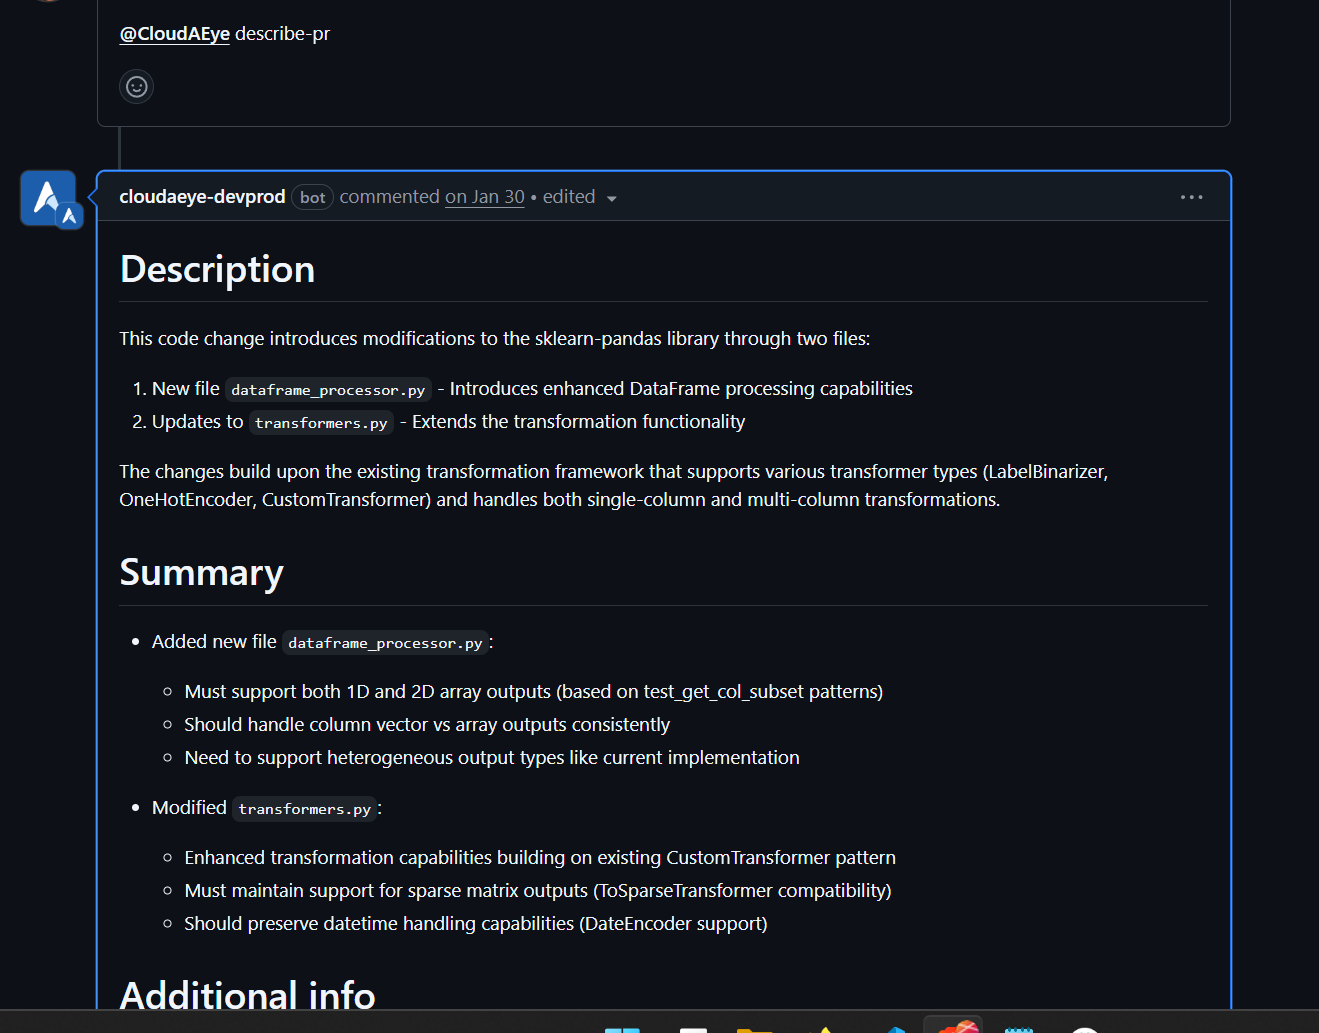
Picture 1: Email Alerts

For demonstration purposes, I have deployed some sample apps - ExpressCart, Sock Shop and ToDo apps on Fargate. I have streamed the logs and metrics to CloudAEye SaaS and deployed the AI-driven logs and metrics analyzers.

Below are code examples of how I have setup logs and metrics streaming.

% caeops logs install-agent --service-name "sock-shop-logs" --cloud aws --source ecs-fargate --app-name "sock-shop" --ecs-cluster-name "sock-shop-cluster"

See more details on logs agent

% caeops metrics install_agent --service-name "sock-shop-metrics" --cloud aws --source ecs-fargate --ecs-cluster-name "sock-shop-cluster" --app-name "sock-shop"

See more details on metrics agent

To simulate failures, I then manually injected different faults such as killing the database, killing the pods, etc. to check how the AI models perform. Shortly after the anomalies were injected, I received emails from the system notifying me that there was an anomaly detected by the AI models.

Logs Dashboard

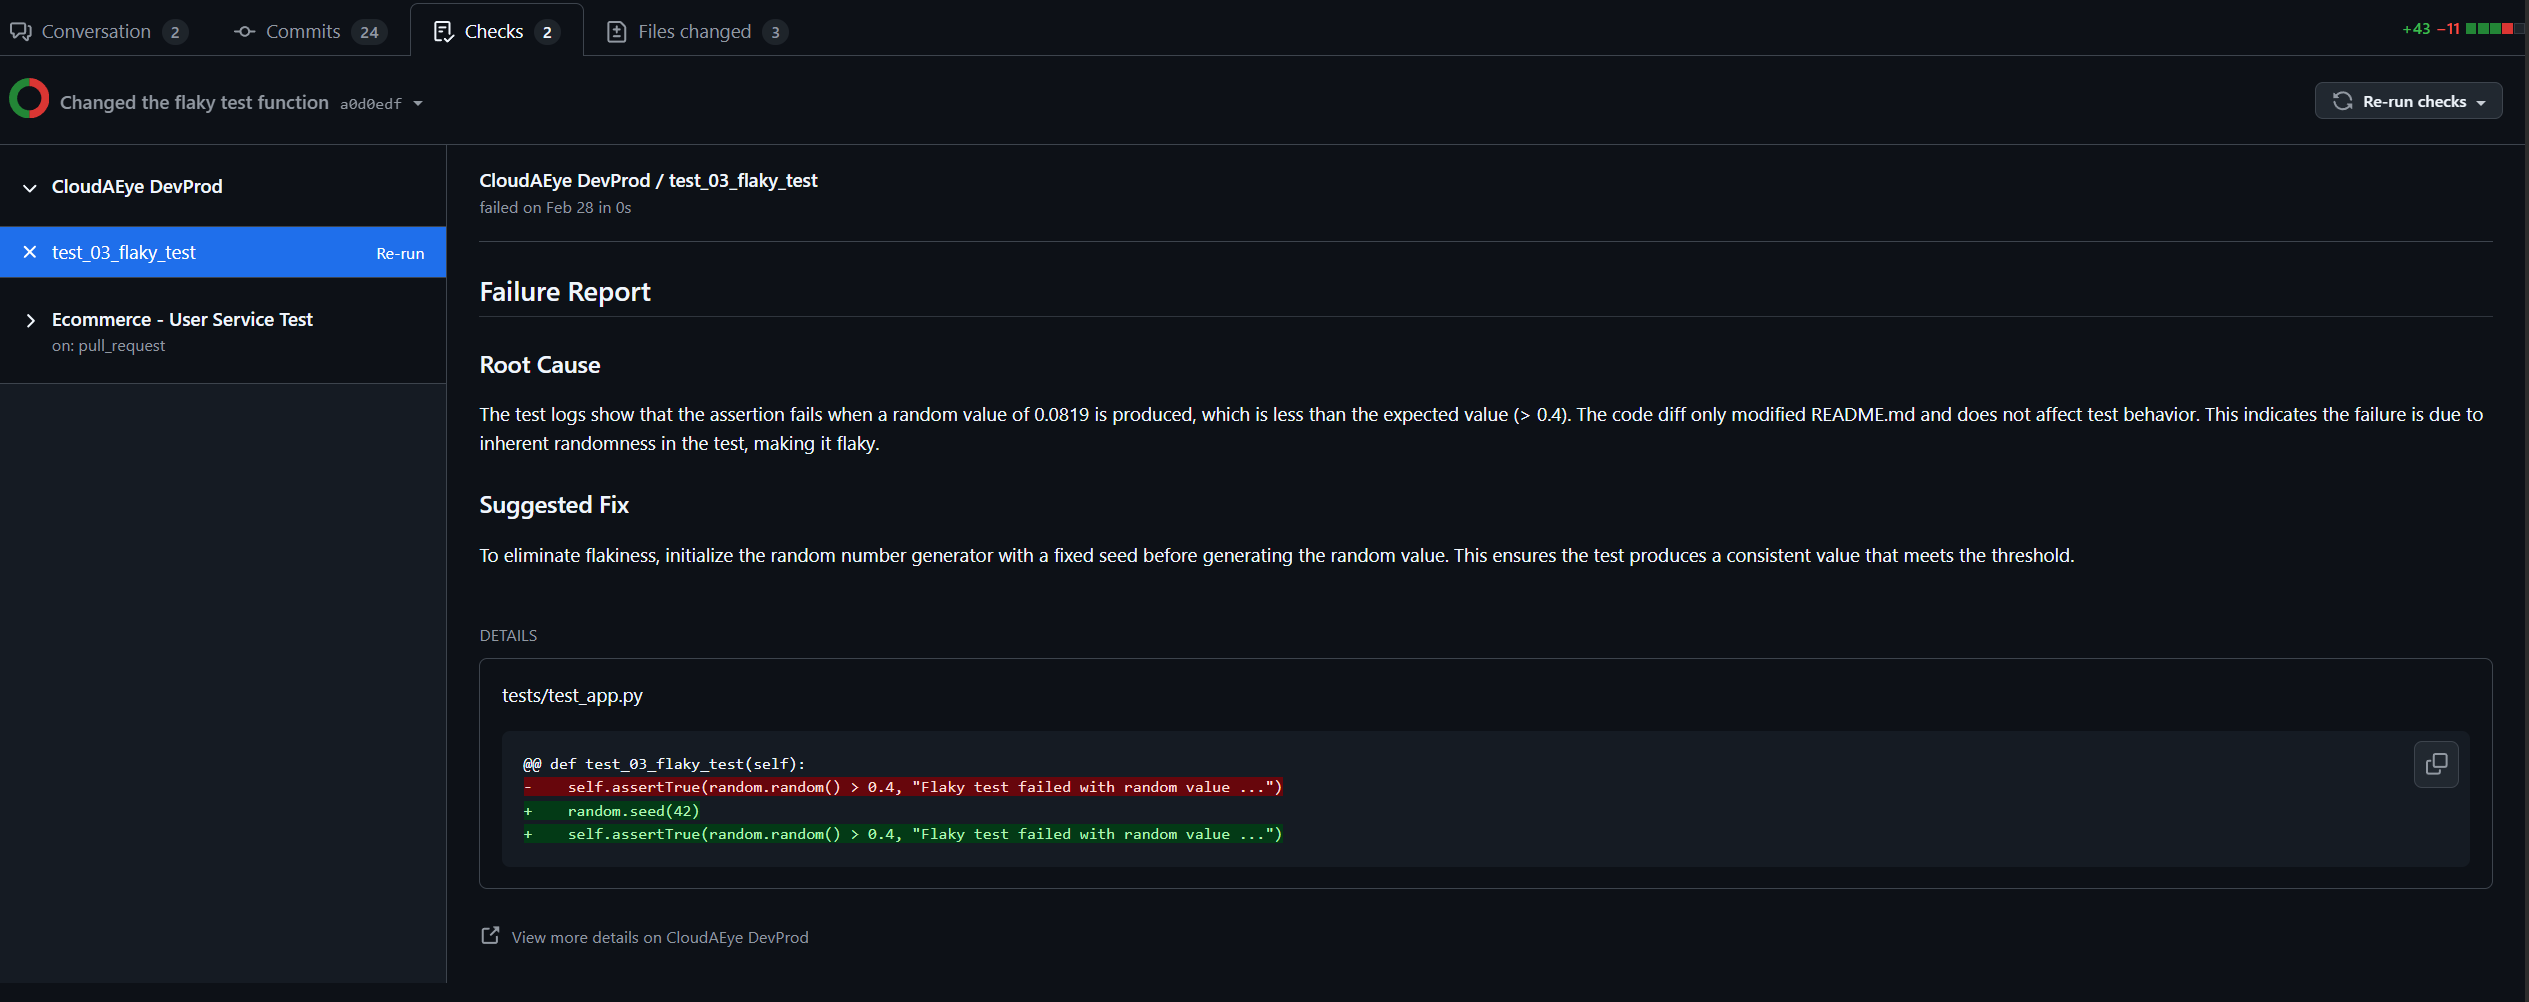
Picture 2: Logs Anomaly Dashboard

On clicking the link provided by the logs alert system, I was directed to the Kibana dashboard. This can also be accessed through the UI console.

This dashboard provides various interpretations of the anomalies, including

  • Pie charts showing the distribution of anomalous logs based on the confidence with which our AI models could predict the anomalies
  • A dashboard where each anomaly can be viewed individually
  • Time series histograms for depicting the time in which the anomalies occurred, and the overall frequency of the log messages

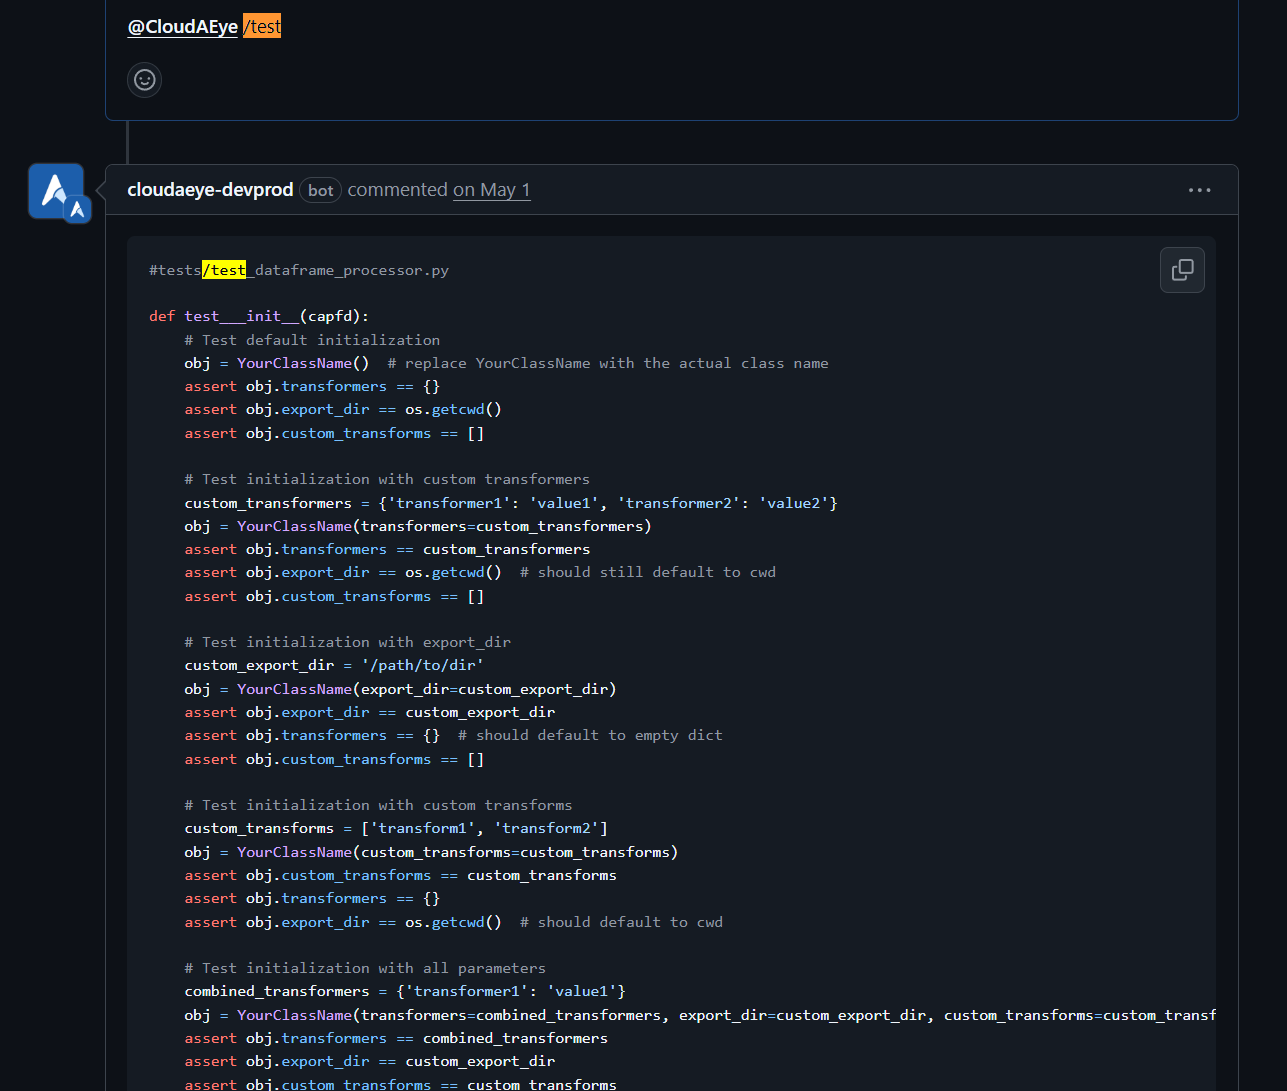
Picture 3: Logs Dashboard - Single Anomaly

  • Speedometers representing the frequencies of different confidence levels of the anomalies.
  • Error history, which contains the entire sequence of the log messages that led to an anomaly, and what followed it.

On clicking a single error-id, the dashboard displays the details for that individual error. Based on the information on the dashboard, it becomes very easy for the user to track an anomaly, analyze its impact, and occurrences. Further, based on the sequential log messages around that time frame produced by the microservices, it was possible to get to the root cause of the system failure and make decisions accordingly.

Why Should You Use the Intelligent Services of CloudAEye?

Our development goal is to deliver the ultimate AI models that would act as "virtual SRE" team members for our customer. Instead of using off the shelf algorithms such as KNN or static rule based approaches, we have custom built and integrated best in class ML/DL algorithms and techniques stemming from years of industry and academia research. Our models use sophisticated approaches that are far beyond simple KNN type algorithms.

Intelligent AI to Monitor Real-time Logs and Metrics with an Alert System

We use sophisticated Machine Learning and Deep Learning algorithms to detect any anomalous activities in your applications. Instead of having trivial scripts or visual representations to help troubleshoot your problems, we have active analyzers which use ensembles of different AI models that are trained to detect different types of anomalies. As soon as anomalies are detected, we will notify you of the error along with a visual interpretation in the dashboard.

You will thus be alerted about the anomalous activities in real time and with the help of the visualizations in the dashboard, you can understand and troubleshoot the problems quickly. This reduces MTTD (mean time to detect) and MTTR (mean time to repair).

Debug Your Applications with Smart Systems

If your system is not behaving correctly but not throwing any errors after an update or a release, it becomes a daunting task to identify the faults in the system. With the help of our AI models which learns to track the workflow of your applications, in such cases, we will notify you of the anomalous behavior highlighting the processes, logs and metrics that were behaving incorrectly because of the new changes.

In Depth Interpretation of Anomalies

We offer a great advantage while troubleshooting over trivial methods such as searching for keywords such as “exception” or “error” log messages in elastic. An error log message can be ambiguous and could be produced for a number of reasons. It is thus inconvenient to get to the root cause of a problem with that approach.

Our system groups the sequences of events that a process went through to cause the error which will give you a much better interpretation of the anomaly. We are continuously tracking the logs and metrics and along with the sequences of logs that caused the error, we surface the top metrics that were reflecting the anomaly. With the combined knowledge of both the process activity that caused the error and the KPI metrics reflecting it, it becomes easy to debug a problem and reach a solution.

We Find the Needle in the Haystack for You

Large systems with hundreds of microservices produce millions of logs per day and have thousands of KPI metrics which track their behavior. Having humans in the loop to actively track the data and to identify anomalous behavior is next to impossible in such scenarios. Our AI models can perform this task efficiently and can save you hours of effort, downtime, and thus money. Consider us as your co-pilot to help you ensure smooth functioning of your application with fast recovery rates.

Want to Try AI to Manage Your Microservices?

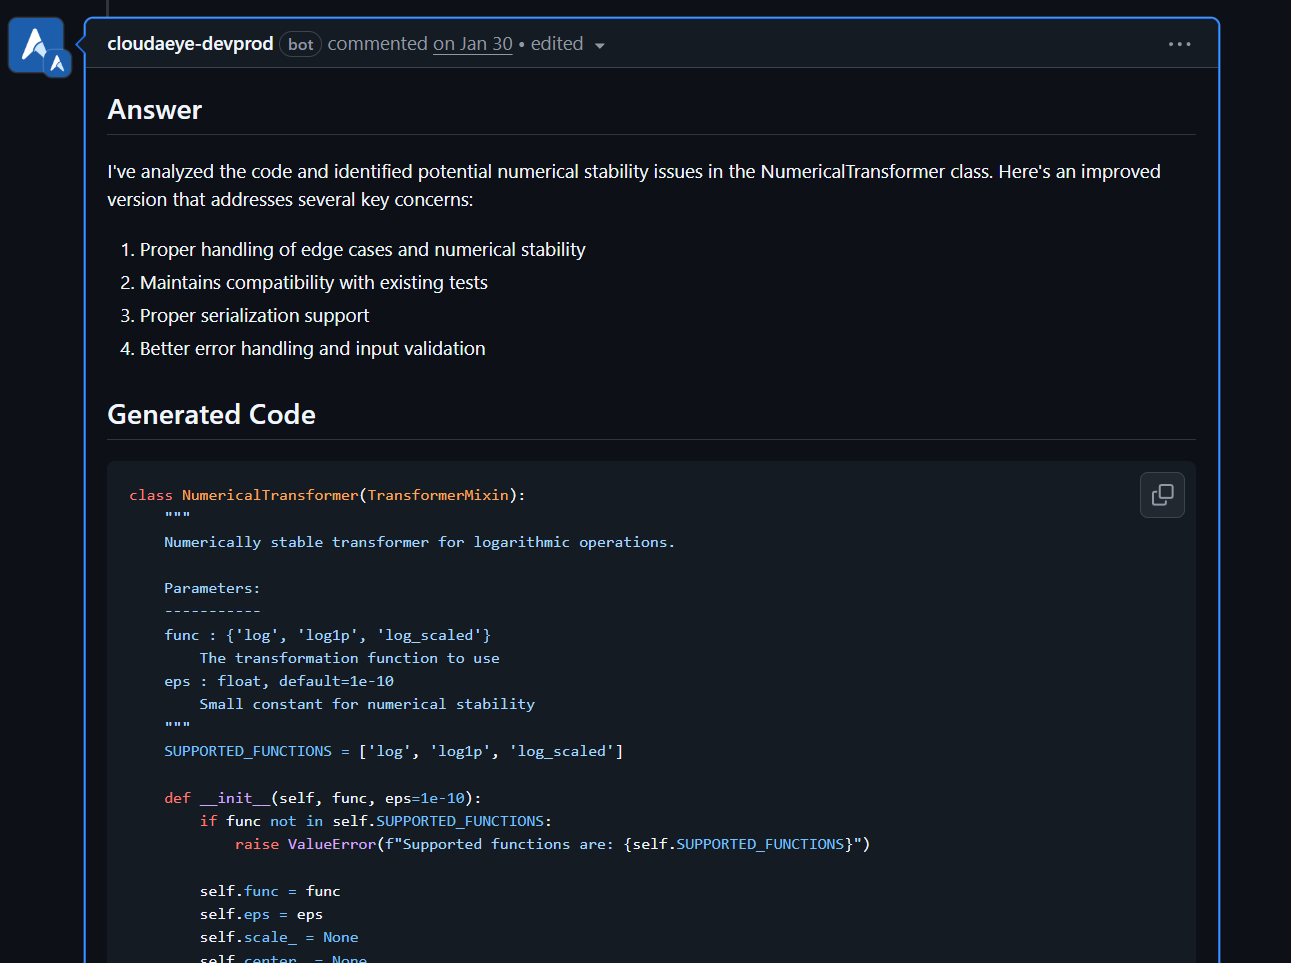
Picture 4: CloudAEye SaaS Sign up Page

Prawigya Pariyar

Prawigya Pariyar is a member of the AI team of CloudAEye. He completed B. Tech from Vellore Institute of Technology, India. He is named inventor in one patent that focused on aiding the blind with AI.