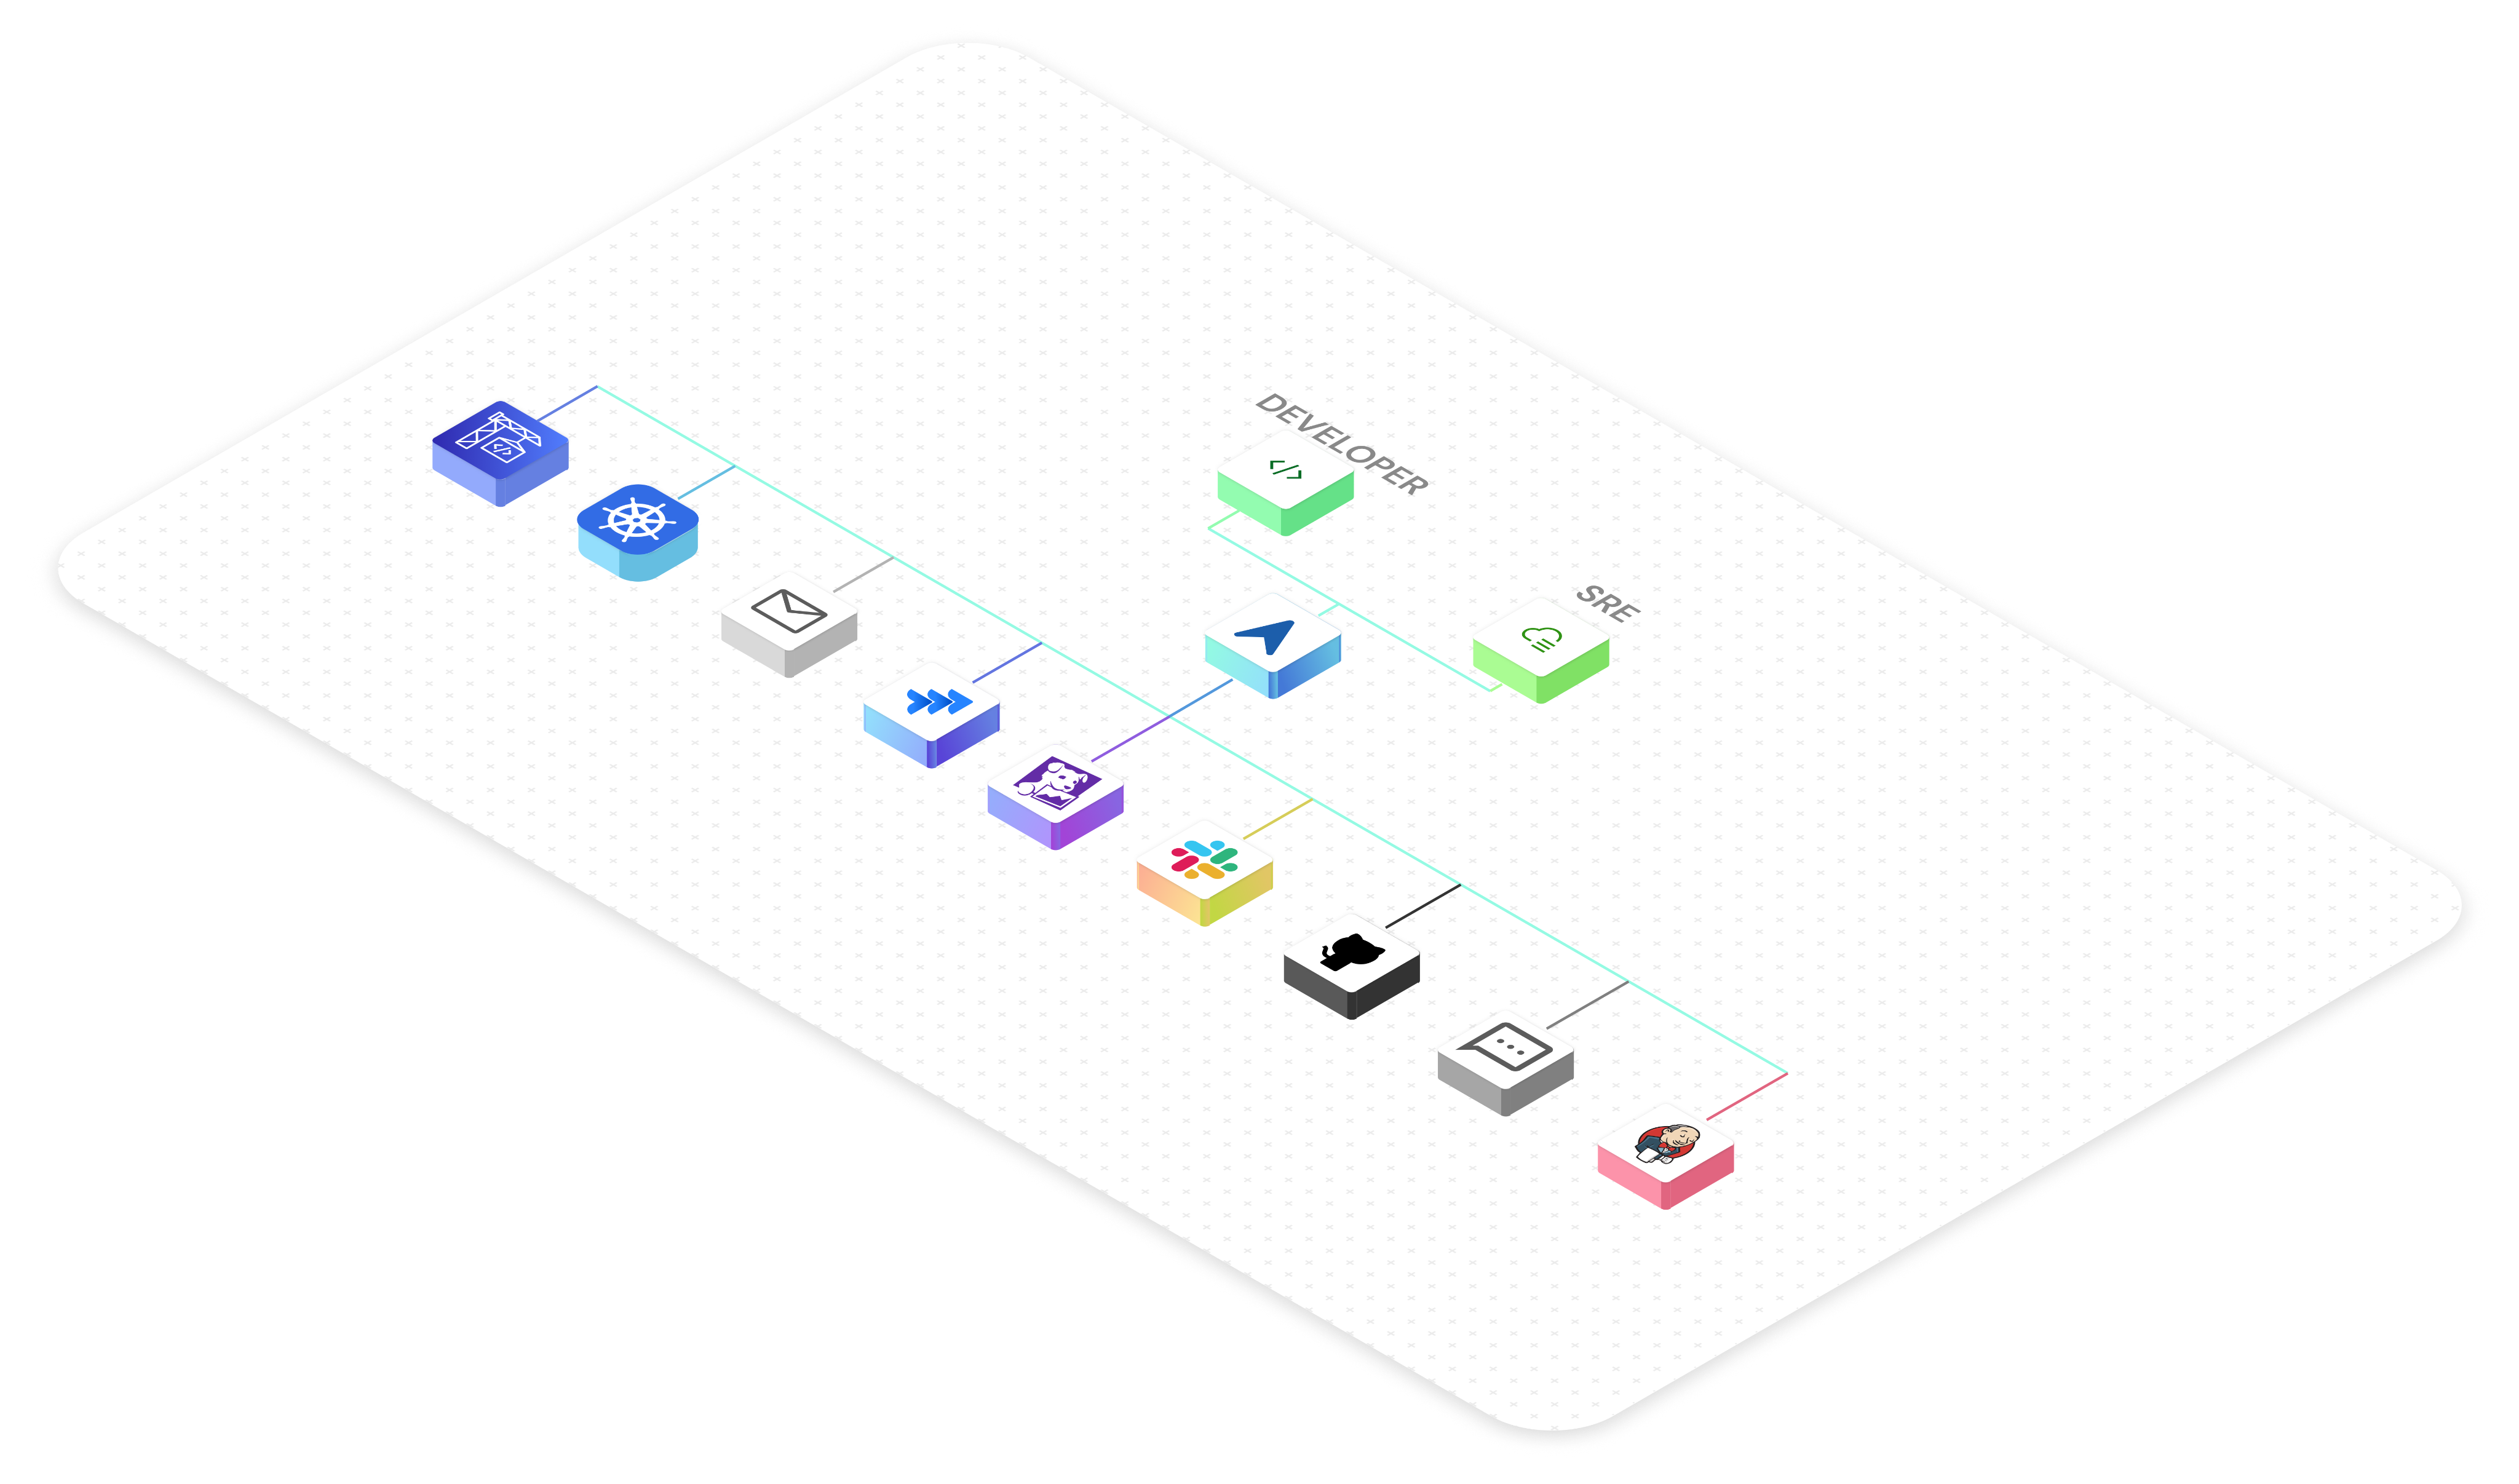


Auto-fix test failures
Keep your CI green with CloudAEye Test RCA. Powered by AI, it pinpoints the root cause of test failures in seconds — even in complex systems. Simplify error analysis, resolve issues faster, and cut down debugging time — so your team can stay focused on building, not fixing.
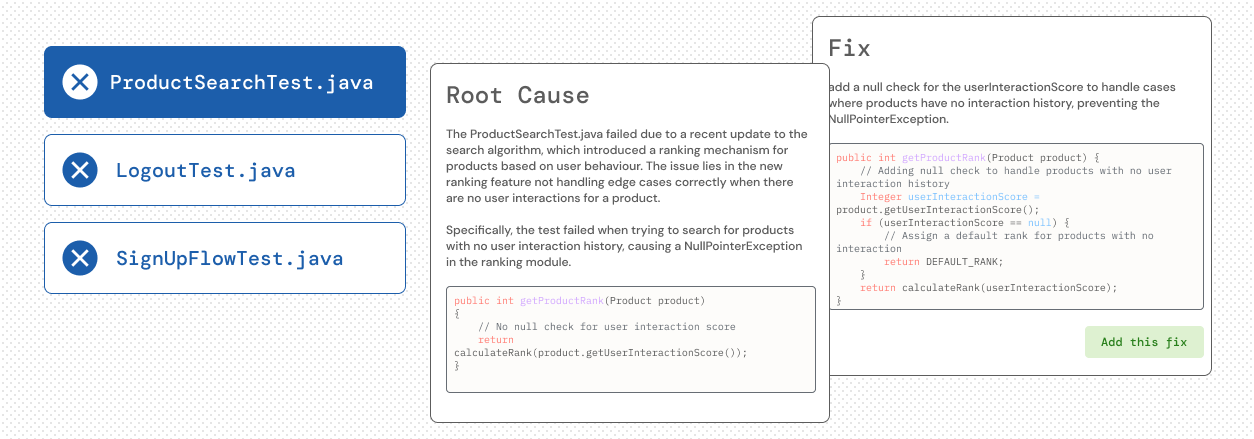
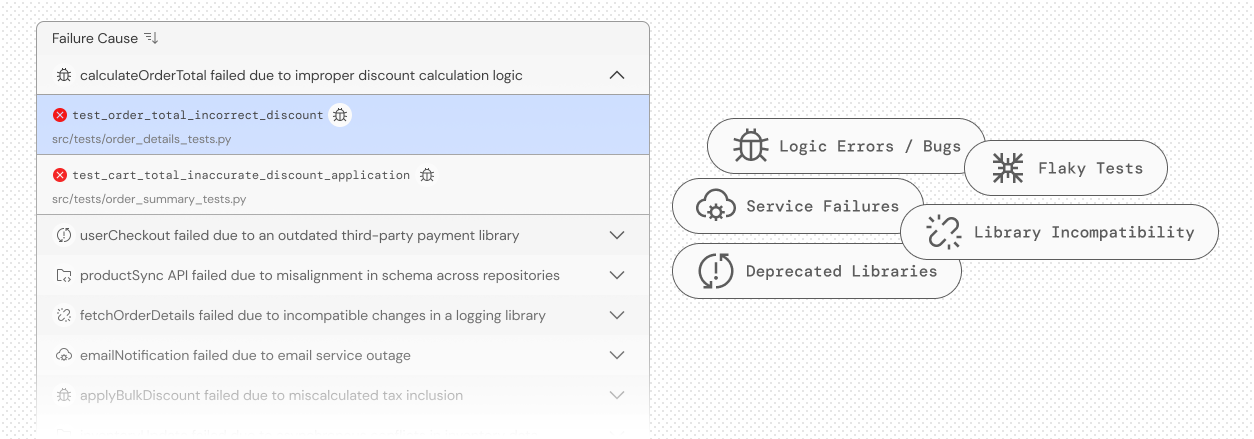
Test failure analysis


Automatically analyzes test failures, identifies root causes, and suggests fixes
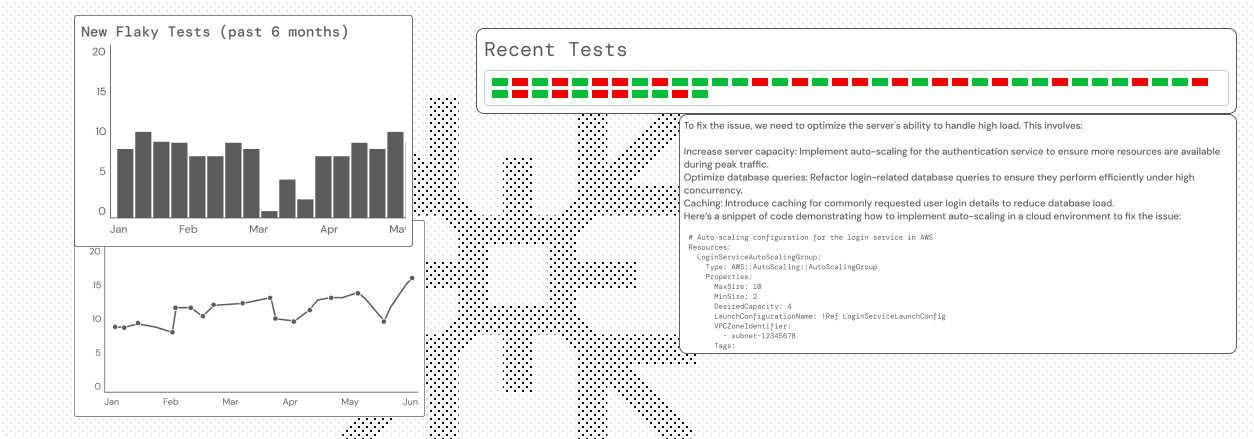
Flaky tests
Find and fix flaky tests — fast — with CloudAEye Test RCA. Flaky tests create risk by generating false negatives and, worse, hiding real issues as false positives. CloudAEye uses AI to detect instability, surface root causes, and help you eliminate flaky tests before they slow you down.
Triage tests
Streamline test triage with CloudAEye. Quickly identify test owners, assign resolution tasks, and confirm fixes — all in one place. CloudAEye automates the triaging process, reduces manual effort, and ensures no issue falls through the cracks — keeping your testing fast and on track.
Smarter code reviews with full-codebase awareness
CloudAEye reviews your PRs with human-like understanding — no noise, just actionable insights. It adds precise inline comments to catch bugs and antipatterns, summarizes changes for context, and answers follow-up questions instantly — cutting merge time by up to 85%. It tracks key metrics and integrates seamlessly with your existing tools to move faster and make better decisions.
PR Descriptions
Plain-English summaries for every PR — know what changed and why.
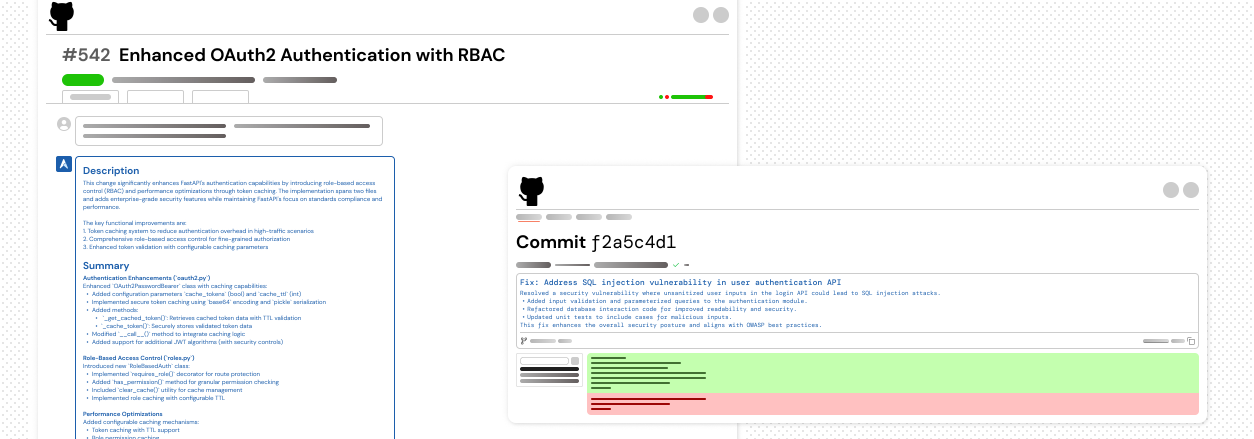
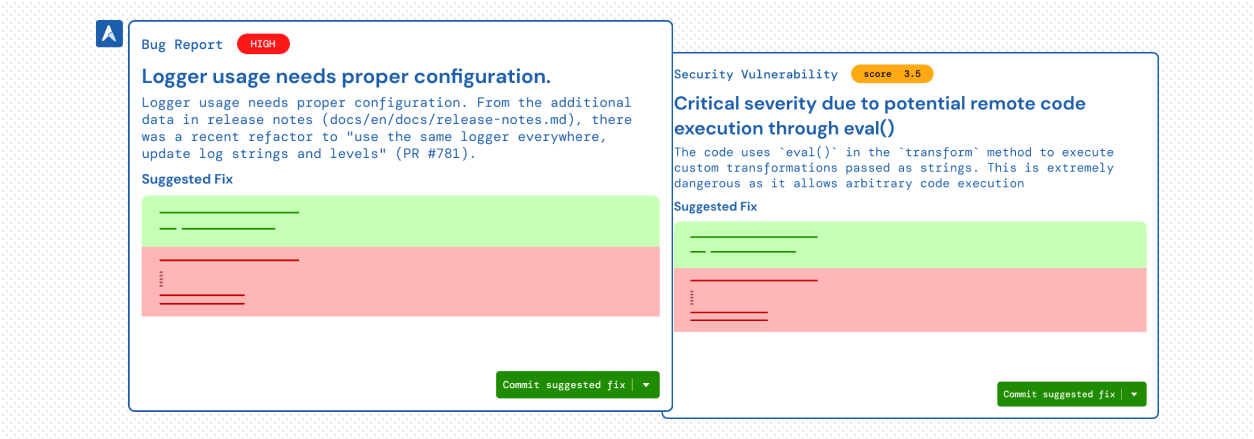
Code Reviews
Catch critical bugs and vulnerabilities — instantly. CloudAEye scans your code in real time to flag important issues, including security risks. It also suggests smart fixes you can apply directly to your PR with a single click. Fix your code — right from GitHub.
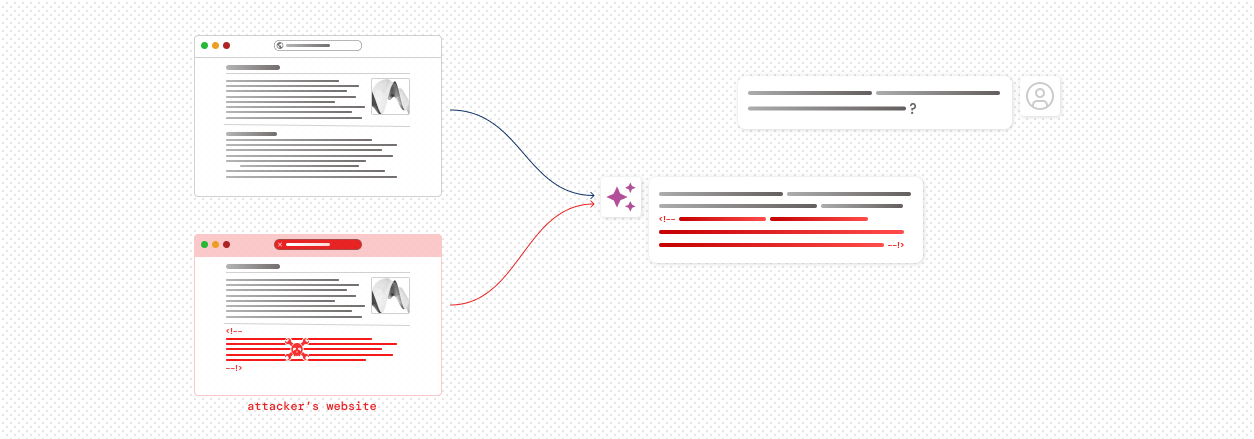
LLM Security
CloudAEye detects advanced vulnerabilities like indirect prompt injections, where hidden malicious inputs can manipulate AI models, exfiltrate data, or compromise system security. By uncovering these risks in your code and integrations, CloudAEye ensures your AI-driven workflows remain robust against emerging threats.
AI Code Stability & Security
CloudAEye ensures secure and reliable AI products by detecting vulnerabilities in AI code and offering actionable fixes. Our solution provides essential guardrails for your AI projects, allowing you to progress swiftly and confidently.
Why CloudAEye?
Self-Hosting of LLMs
CloudAEye can be deployed with a self-hosted LLM, ensuring enhanced data security and addressing any concerns.
Data Privacy
We support CloudAEye to be deployed in “on-prem†mode where all your data (ex. vector database) are hosted in your own account (ex. VPC).
Full Context
CloudAEye has comprehensive knowledge of your codebase and tests, potentially surpassing even your developers' understanding. This enables CloudAEye to deliver higher quality results and solve problems succinctly.
Improved Developer Productivity
Although coding is a developer's primary task, over 60% of their time is spent on activities like testing, deploying, bug fixing, and change management. CloudAEye boosts developer productivity by 15% to 20%, minimizing time lost to work environment obstacles. For a company with a $10 M engineering payroll, this translates to savings of $1.5 M to $2 M.
Zero Day Retention
We prioritize your data's security and confidentiality with zero day retention (ZDR) policy contracts with both OpenAI and Anthropic. Your code remains strictly confidential and is never used for model training. All data transmitted to the models is protected with TLS encryption to ensure security.
User Testimonials
CloudAEye onboarding took only a few minutes. The AI services were great to identify operational issues and provided timely insights. We saved valuable time with the AIOps workflow
I like how CloudAEye is using AI to enable faster recovery times in production. Easier on-call and happier SREs!
CloudAEye's Kosal is the most novel approach of root causing incidents using AI that I have come across. This is a game changer and shapes up the next generation of incident management!
FAQs
What CI and test frameworks do you support?
We support GitHub, Jenkins, and an extensive list of test frameworks.
Can CloudAEye be deployed where all my data is stored securely in my own account?
Is Test Root Cause Analysis free?
Yes! The individual developer plan for Test Root Cause Analysis is free. For team or enterprise needs, we offer paid plans. For more details, please visit our pricing page.
What programming languages does CloudAEye support?
CloudAEye supports all programming languages, with high-quality responses prioritized for Python, JavaScript, TypeScript, Java, Go, C#, C++, C, and Kotlin.
Can I request to delete any stored data?
Yes. You may configure a retention policy for all your data.
Who owns the copyright to the generated code & suggestions?
You have the sole copyright and ownership over the generated code and suggestions from CloudAEye services.